Don't Be Fooled By Numbers Book Cover
A Kid's Guide to Data Tricks
by VJ Siddhaiyan

What's Inside

  1. Misleading Graphs
  2. Cherry-Picked Data
  3. Averages vs. Medians
  4. Tricky Percentages
  5. Survivorship Bias
  6. Sample Size & Selection
  7. The Base Rate Trap
  8. Framing Effects
  9. Polls & Surveys Gone Wrong
  10. The Ice Cream Murder Mystery

Welcome, Data Detective!

Someone is lying to you with numbers. Let's catch them.

Numbers Look Like Facts — But They Can Lie

Here's something wild: numbers feel trustworthy. When someone says "Studies show..." or "The data proves..." your brain relaxes a little. Numbers seem objective. Scientific. Real.

But here's the secret that advertisers, politicians, and even your friends already know: numbers can be twisted to tell almost any story you want.

The same data can make a school look amazing or terrible. The same statistic can make a medicine sound like a miracle or a disaster. The same graph can make a tiny change look enormous or a huge change look invisible — just by changing how you draw it.

This isn't a math book. You don't need to be great at math to read this. This book is about asking smart questions when someone throws numbers at you. It's defense training — like learning to spot a magic trick so you can't be fooled by it anymore.
Think of yourself as a data detective. Every number is a clue, every graph is a piece of evidence, and every statistic is a witness — but some of those witnesses are lying. Your job is to figure out which ones.

By the end of this book, you'll know 10 sneaky data tricks and exactly how to see through each one. You'll never look at a graph, a headline, or a "9 out of 10 dentists recommend" claim the same way again. Ready to investigate? Let's go!

The 10 Data Tricks

"It ain't what you don't know that gets you into trouble. It's what you know for sure that just ain't so." — Mark Twain

Chapter 1

Misleading Graphs

"Stretching the Truth"

A graph with a magnifying glass revealing hidden tricks

What's the Trick?

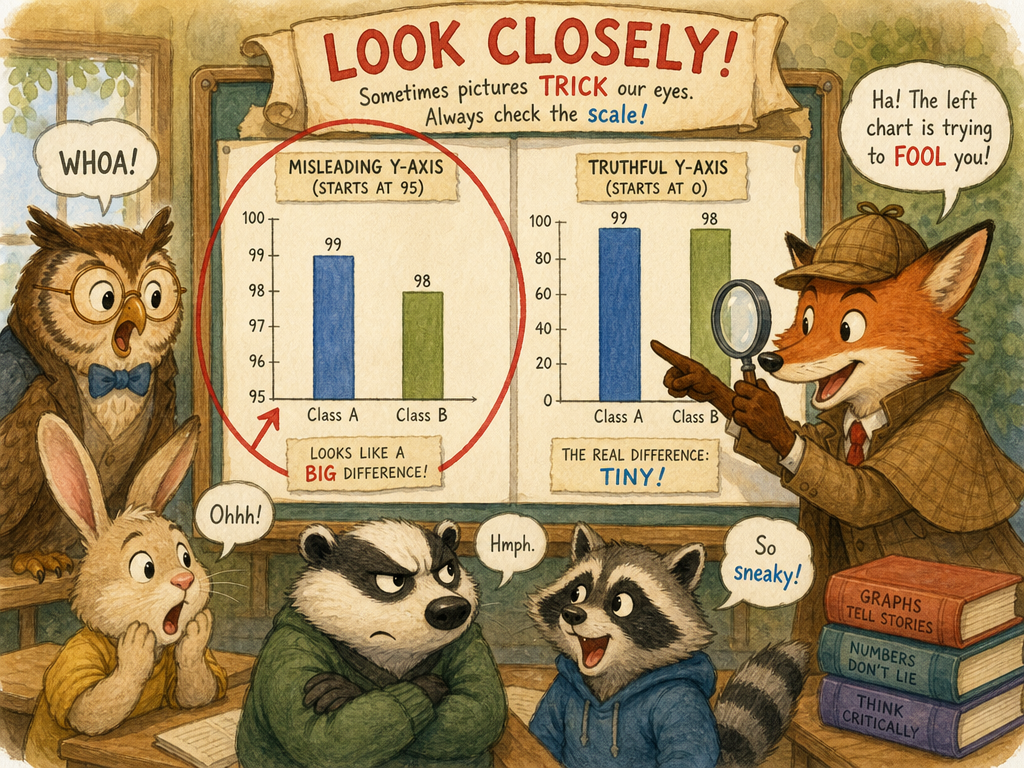
Graphs are supposed to help us see data clearly. But sneaky graph-makers can manipulate axes, scales, and visual effects to make tiny changes look massive — or huge changes look like nothing. A graph isn't lying with words. It's lying with shapes.

Tricks in the Wild

IN THE NEWS

Headline: "Company profits SKYROCKET!"

The graph shows the bar going from the bottom to the top of the screen. Looks like profits tripled! But wait — the y-axis starts at $98 million and ends at $101 million. Profits went up by $3 million out of $100 million. That's a 3% bump, not a "skyrocket."

By chopping off the bottom of the axis, a small change fills the whole graph and looks enormous. Always check where the axis starts!

IN A SCHOOL PRESENTATION

Student: "Our fundraiser was WAY more successful than last year! Look at this graph!"

The graph shows this year's bar towering over last year's. But last year they raised $480 and this year $520. The y-axis goes from $470 to $530, making a $40 difference look like a landslide.

If the y-axis started at $0, both bars would look almost identical. The "zoom-in" trick makes small differences look dramatic.

IN AN AD

Toothpaste ad: "Our brand reduces cavities significantly!" The ad shows a fancy 3D pie chart where one slice looks huge. But 3D effects distort sizes — a slice in the "front" of a 3D pie chart looks bigger than the same-sized slice in the "back."

3D charts look cool but distort the data. They're almost always used to trick you, not to inform you.

ON SOCIAL MEDIA

Post: "This city's crime rate is OUT OF CONTROL!" The graph shows crime from January to June going sharply up. But the full-year data shows crime peaks every summer and drops every winter. They just cherry-picked the rising half.

Choosing the right time range can make any trend look like it's going up or down. A graph that shows only 6 months might tell a very different story than one showing 5 years.

Why It Fools People

Our brains process images faster than numbers. When we see a bar shooting up or a line plunging down, we feel the change before we read the actual values. Graph-makers exploit this by adjusting the visual scale while the real numbers barely move.

How to See Through It

1. Always check: does the y-axis start at zero? If not, the visual scale is exaggerated.
2. Read the actual numbers, not just the shapes.
3. Be suspicious of 3D charts — flat charts are almost always more honest.
4. Ask: what time range is being shown? Would a longer or shorter range change the story?

Try It!

Find a graph in a news article or ad online. Check if the y-axis starts at zero. If it doesn't, try imagining what the graph would look like if it did. Does the "big change" still look big?

Bonus: look for 3D graphs and ask yourself why they used 3D instead of flat. The answer is almost always "to make it look more impressive than it is."

Chapter 2

Cherry-Picked Data

"Only Showing the Good Stuff"

A hand picking only the best cherries from a bowl of data

What's the Trick?

Cherry-picking is when someone selects only the data points that support their argument and conveniently ignores everything else. It's like showing your parents your three best test scores and hiding the other seven.

Tricks in the Wild

IN A PRODUCT REVIEW

Ad: "Our restaurant has amazing reviews! Look: 5 stars, 5 stars, 5 stars!"

What they didn't show: they have 200 reviews, and the average is 2.8 stars. They just picked the three best ones.

Three hand-picked reviews can make any place look amazing. The full picture — all 200 reviews — tells a very different story.

IN SPORTS

Fan: "My team is on a hot streak! We won 3 of our last 4 games!"
Reality: The team's overall record is 5 wins and 15 losses. Those 3 wins are the only bright spot in a terrible season.

Zooming in on a small winning streak hides the bigger losing picture. Always ask: what's the FULL record?

IN THE NEWS

Headline: "Temperatures DROPPED last week — so much for global warming!"

One cold week doesn't erase decades of temperature data. That's like saying "I ate a salad today, so my diet is perfect" when you had pizza for every other meal this month.

Picking one data point (a cold week) and ignoring the trend (decades of warming) is textbook cherry-picking.

AT SCHOOL

Student: "I studied for 4 hours last Sunday!"
Teacher: "And what about Monday through Saturday?"
Student: "...let's not talk about those days."

One good day doesn't represent a whole week of study habits. The full picture matters.

Why It Fools People

We naturally pay more attention to evidence that confirms what we already believe. Cherry-pickers exploit this by giving us only the "confirming" data. Since we never see the contradicting data, everything feels like it lines up perfectly.

How to See Through It

1. Always ask: "What data am I NOT seeing?"
2. Check the full dataset, not just the highlighted examples.
3. Be suspicious when someone shows only a few data points from a much larger set.
4. Look for the overall trend, not just individual moments.

Try It!

Imagine you scored 95, 42, 88, 51, 90, 45, 93, 40, 87, and 50 on ten quizzes. Pick the five scores that make you look like a genius. Now pick the five that make you look like you never studied. Same student — completely different stories!

That's the power (and the danger) of cherry-picking.

Chapter 3

Averages vs. Medians

"The 'Average' Lie"

Bill Gates walking into a coffee shop and the average wealth skyrocketing

What's the Trick?

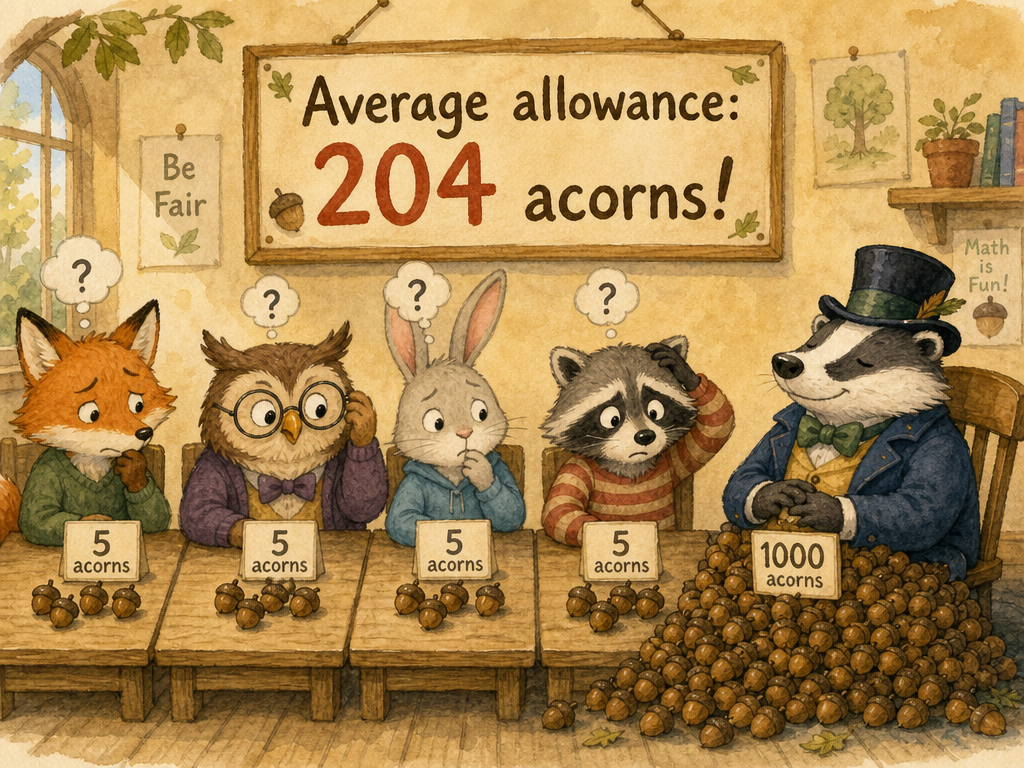
The word "average" sounds simple, but it hides a sneaky trap. There are different kinds of averages, and picking the wrong one — accidentally or on purpose — can paint a wildly misleading picture. The mean (add everything up and divide) gets wrecked by extreme values. The median (the middle number) often tells a much more honest story.

Tricks in the Wild

THE BILLIONAIRE IN THE COFFEE SHOP

Ten people are sitting in a coffee shop. Each one has about $50,000 in savings. The "average" savings? $50,000. Makes sense.

Now Bill Gates walks in. His net worth is about $100 billion. The new "average" savings in the room? Over $9 BILLION per person. But nobody else got richer! The median is still $50,000.

One extreme value dragged the mean up by a ridiculous amount. The median didn't budge. When you hear "average," always ask: mean or median?

SCHOOL FUNDRAISER

Principal: "The average student raised $75 for the fundraiser!"

Reality: Most kids raised $10–$20. But one student's parents donated $800, which yanked the mean way up. The median amount raised was actually $15.

Reporting the mean makes the fundraiser sound like a massive success. Reporting the median shows what the typical student actually did.

IN A JOB AD

Company: "Our employees earn an average salary of $120,000!"

Reality: The CEO makes $2 million. Most employees make $45,000. That one huge salary inflates the "average" for everyone.

The company used the mean to make salaries sound much higher than what most employees actually earn.

VIDEO GAME STATS

Gamer: "My average score per round is 2,400 points!"

Their last five scores: 200, 300, 150, 250, and 11,100. That one monster round dragged the average way up. Their typical score is around 200–300.

One lucky game doesn't make you an elite player. The median score tells you what to actually expect.

Why It Fools People

Most people hear "average" and picture "typical." But the mean can be wildly different from what's typical when extreme values are involved. People who want to mislead you will always pick whichever type of average makes their story sound better.

How to See Through It

1. When you hear "average," ask: is this the mean or the median?
2. Look for outliers — extreme high or low values that could skew the mean.
3. Ask: what does the TYPICAL person/student/player actually experience?
4. If the mean and median are very different, that's a red flag.

Try It!

Your friends' allowances: $5, $5, $10, $5, $10, $5, $5, $200 (one friend has very generous grandparents). Calculate the mean and the median. Which one describes the "typical" allowance better?

Mean = $30.63. Median = $5. The mean is 6x higher than what most kids actually get!

Chapter 4

Tricky Percentages

"Sounds Scary, But Is It?"

A magnifying glass revealing tiny base numbers behind scary percentages

What's the Trick?

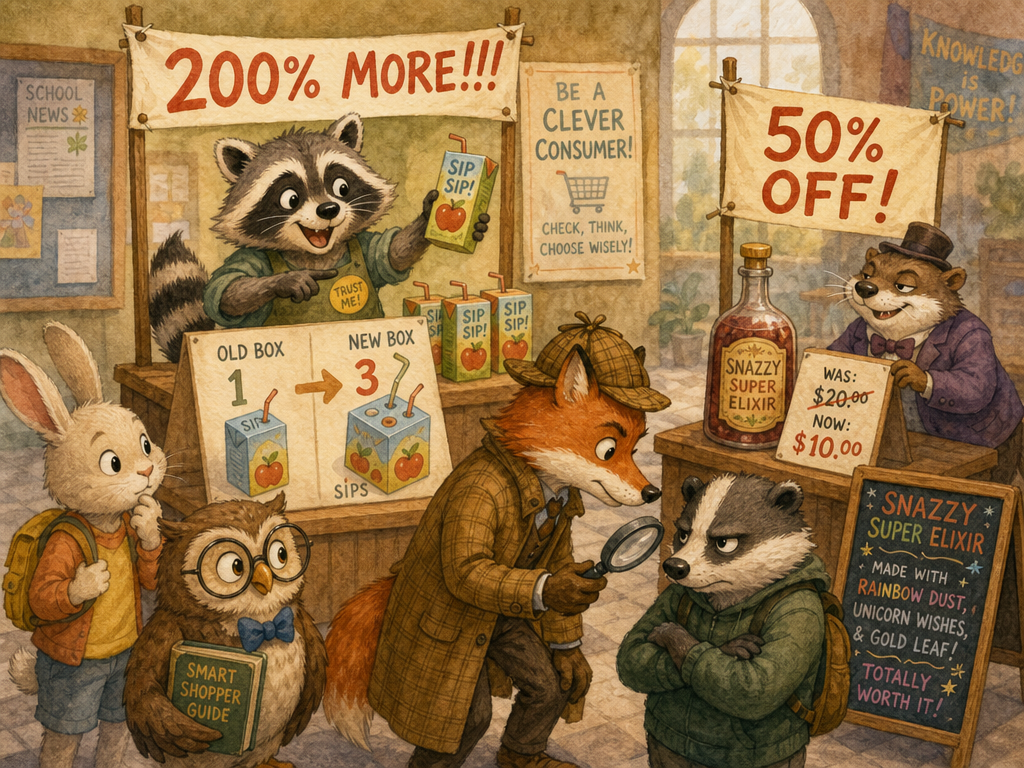
Percentages sound impressive, but they're meaningless without knowing the base number — the number you started with. "200% increase!" sounds terrifying. But if it went from 1 to 3... that's just 3. The base number is everything.

Tricks in the Wild

IN A SCARY HEADLINE

Headline: "Shark attacks UP 100% this year!"

Reality: Last year there was 1 shark attack at that beach. This year there were 2. That's a 100% increase... of ONE extra shark attack. Your odds are still incredibly tiny.

A 100% increase from a tiny number is still a tiny number. Always ask: 100% of WHAT?

IN AN AD

Shampoo ad: "73% of women agree their hair feels softer!"

Fine print: "Based on a survey of 11 women." So... 8 out of 11 people liked it. That's not exactly a scientific breakthrough.

Percentages from tiny samples sound more impressive than the raw numbers. "8 out of 11 women" doesn't quite have the same ring as "73%."

AT SCHOOL

Student: "I improved my grade by 50%!"
Teacher: "You went from a 40 to a 60. That's still a D."

50% improvement sounds amazing. Going from 40 to 60... less so.

The percentage makes the improvement sound massive. The actual numbers tell you it's a D either way.

IN A YOUTUBE VIDEO

Thumbnail: "This game's player base CRASHED 300%!!!"

Aside from the fact that you can't actually decrease by more than 100% (think about it — you can't lose more than everything), the game went from 4 concurrent players to 1. Hardly a crisis.

Huge percentages applied to tiny numbers create fake drama. And mathematically, nothing can decrease by more than 100%!

Why It Fools People

Our brains react to big-sounding numbers. "200% increase!" triggers alarm bells before we even think about what 200% of a tiny number actually is. Advertisers and headline writers know this and exploit it constantly.

How to See Through It

1. Always ask: "Percent of WHAT? What's the base number?"
2. Convert the percentage back into real numbers.
3. Remember: nothing can decrease by more than 100%.
4. Watch for percentages based on tiny samples — they sound scientific but aren't.

Try It!

Which sounds scarier? "Cases of the rare disease increased by 300%!" or "Cases went from 2 to 8 in a country of 330 million people." Same data — totally different feeling. Try rewriting a scary percentage headline using the actual numbers instead.
Chapter 5

Survivorship Bias

"Where Are the Ones Who Didn't Make It?"

A spotlight on one winner while thousands of losers sit in shadow

What's the Trick?

Survivorship bias happens when we only look at the people or things that "survived" a process (the winners, the successes, the famous ones) and ignore all the ones that didn't. This creates a completely warped picture of reality because we're drawing conclusions from an incomplete dataset.

Tricks in the Wild

IN A MOTIVATIONAL VIDEO

Video: "This famous CEO dropped out of college and built a billion-dollar company! Follow your dreams and drop out!"

What they don't mention: for every college dropout who became a billionaire, there are millions who dropped out and struggled financially. We just never hear their stories.

We see the one who made it. We don't see the millions who took the same risk and lost. The survivors get the interviews — the failures stay invisible.

IN MUSIC

Kid: "That singer was discovered on YouTube! I should skip homework and make videos instead!"

For every person discovered on YouTube, there are millions of channels with great content and 12 views. You only hear about the one in a million who broke through.

The success stories get all the attention. The identical-effort failures are invisible, making success look more common than it is.

IN HISTORY CLASS

Student: "Buildings from hundreds of years ago are so much better than today's! Old stuff lasts forever."

Actually, 99% of old buildings already crumbled and disappeared. We only see the 1% that survived. The bad old buildings are gone. The bad new buildings are still here.

Old things seem better because only the best examples survived. All the terrible old stuff is already dust.

IN THE APP STORE

Kid: "Making an app is easy money! Look at all these successful apps!"

The app store has millions of apps. The ones you've heard of are maybe a few hundred. For every Instagram there are 10,000 apps that cost months to build and made $0.

Top charts show survivors. The graveyard of failed apps is massive but invisible.

Why It Fools People

Failures are invisible. We literally can't see them because they don't get coverage, don't get interviewed, and don't make headlines. Our brain builds its model of reality from what it can see — and what it sees is only the winners.

How to See Through It

1. Always ask: "What happened to the ones who DIDN'T make it?"
2. Look for the failure rate, not just the success stories.
3. Remember: the news covers the exception, not the rule.
4. Be suspicious of advice based on a single success story.

Try It!

Next time someone tells you about a famous person who succeeded by doing something unconventional, ask: "How many people tried the exact same thing and failed?" If nobody can answer that question, you might be looking at survivorship bias.
Chapter 6

Sample Size & Selection

"Who Did You Actually Ask?"

A tiny group of people being used to represent a huge crowd

What's the Trick?

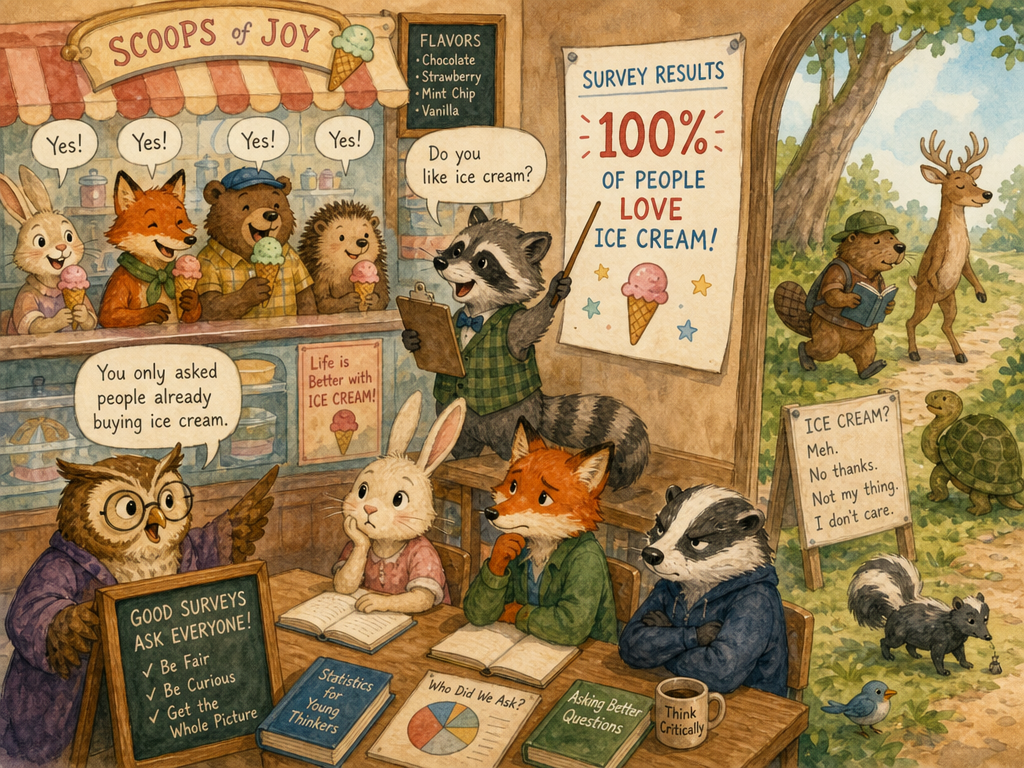
When someone makes a big claim based on data, two questions matter more than anything: How many people did they ask? And who did they ask? A tiny or biased sample can produce results that mean absolutely nothing — but they'll be presented as if they're facts.

Tricks in the Wild

AT LUNCH

Kid: "I did a survey and EVERYONE prefers tacos over pizza for the school party!"
Teacher: "How many people did you ask?"
Kid: "...my three best friends."

Three friends isn't a survey. It's a chat. And if your friends all like tacos, that says more about your friend group than about the whole school.

IN AN AD

Ad: "4 out of 5 dentists recommend our toothpaste!"

Questions a data detective would ask: Which dentists? Were they paid by the toothpaste company? Were they given only two choices? Did 5,000 dentists answer, or just 5?

"4 out of 5" sounds scientific until you realize we know nothing about how those dentists were selected or what question they were actually asked.

ON A YOUTUBE CHANNEL

YouTuber: "I asked my followers and 90% agree that this is the best game ever!"

Of course your followers agree with you! They follow you BECAUSE they share your taste. Asking your own fans if they like what you like is like asking people at a pizza shop if they like pizza.

Self-selected samples (people who choose to respond) are almost always biased. The people who disagree simply didn't bother answering.

IN THE NEWS

Headline: "New study shows chocolate improves test scores!"

Fine print: Study was conducted with 12 participants, all of whom were college students at one university. Can you really apply those results to all ages, all schools, all situations?

A tiny, non-diverse sample tells you almost nothing about the general population. Twelve college kids aren't "everyone."

Why It Fools People

Numbers sound official. "4 out of 5" feels like a scientific result. But the quality of the sample determines the quality of the data. A perfect study with the wrong sample is still wrong.

How to See Through It

1. Ask: "How many people were in the sample?"
2. Ask: "Who chose to participate? Could they be biased?"
3. Be suspicious of surveys where people self-select (online polls, fan votes).
4. Good research uses large, random, diverse samples — look for those words.

Try It!

Design two surveys about school lunches. Survey A: ask 5 friends at your table. Survey B: randomly pick 50 students from all grades. Which would give you a better picture of what the whole school thinks? Why?
Chapter 7

The Base Rate Trap

"Rare Things Stay Rare"

A huge crowd with only a tiny dot highlighted, showing how rare events get overwhelmed by noise

What's the Trick?

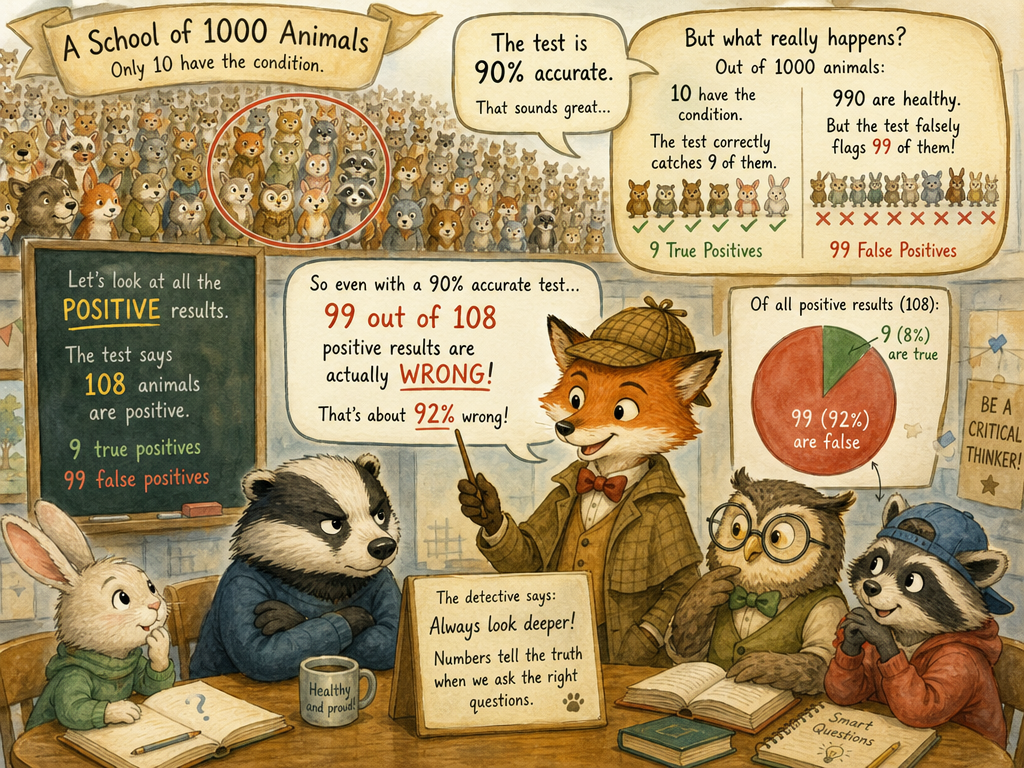
The base rate trap happens when you forget how rare something is in the first place. Even a very accurate test can give you mostly wrong results if the thing it's testing for is extremely rare. This is one of the trickiest concepts in data — and even doctors get it wrong!

Tricks in the Wild

THE DISEASE TEST

A disease affects 1 in 10,000 people. There's a test that's 99% accurate. You test positive. Should you panic?

Let's do the math: Test 10,000 people. 1 has the disease (and the test correctly catches them). But the 1% error rate means about 100 healthy people ALSO test positive by mistake. So out of 101 positive results, only 1 actually has the disease. Your chance of really being sick? Less than 1%.

Even with a 99% accurate test, when the disease is rare, most positive results are false positives. The BASE RATE (how common the disease is) matters enormously.

SCHOOL SECURITY

News: "New AI system detects cheaters with 95% accuracy!"

If only 2 out of 100 students actually cheat, the 5% error rate will flag about 5 innocent students. So most of the "caught cheaters" are actually innocent kids who just typed weirdly.

When the thing you're looking for is rare, false alarms outnumber real catches — even with a very accurate system.

IN AIRPORT SECURITY

Claim: "Our scanner catches 98% of prohibited items!"

Sounds great — until you realize that 99.99% of passengers aren't carrying anything prohibited. The scanner will flag far more innocent travelers than actual threats.

High accuracy + rare events = lots of false alarms. This is why your water bottle gets confiscated but actual threats are extremely rarely caught this way.

Why It Fools People

"99% accurate" sounds nearly perfect. Our brains hear that and think "only 1% chance of being wrong." But when the thing you're looking for is super rare, that 1% error rate creates way more mistakes than real catches. We forget to consider how common or rare the thing is in the first place.

How to See Through It

1. Always ask: "How common is this thing in the first place?"
2. If something is very rare, even very accurate tests will produce lots of false positives.
3. Don't be dazzled by accuracy percentages without knowing the base rate.
4. When in doubt, think about 10,000 people and walk through the math.

Try It!

Imagine a fire alarm that's 97% accurate. In a year, your school might have 0 real fires but the alarm goes off about 10 times due to the 3% error rate (burned popcorn, steam, dust). How many of those alarms were real emergencies? Zero. That's the base rate trap in action.
Chapter 8

Framing Effects

"Same Number, Different Spin"

Two picture frames showing the same data in completely different ways

What's the Trick?

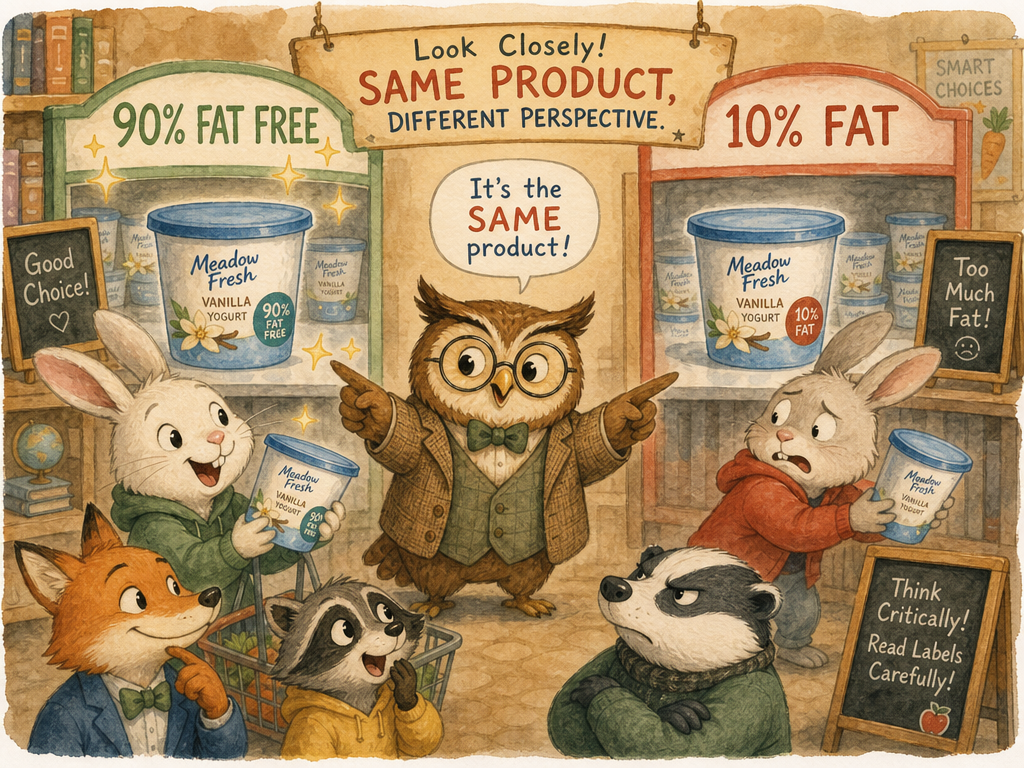
Framing is when the exact same fact is presented in a way that makes you feel completely different about it. "90% fat-free" and "10% fat" are the same thing — but one sounds healthy and the other sounds gross. The data hasn't changed. Only your feelings about it have.

Tricks in the Wild

IN THE GROCERY STORE

Label A: "90% fat-free!"
Label B: "Contains 10% fat."

Same exact product. Same exact fat content. But Label A makes you feel like you're making a healthy choice, while Label B makes you put it back on the shelf.

Marketers always choose the frame that sounds better. "90% fat-free" is the positive frame of a fact that's less appealing when stated as "10% fat."

IN A NEWS REPORT

Headline A: "1 in 4 students failed the state test."
Headline B: "3 out of 4 students passed the state test!"

Same data. Headline A sounds like the school is in crisis. Headline B sounds like a celebration.

Whether you frame it as "25% failed" or "75% passed" completely changes the emotional reaction — even though the fact is identical.

AT THE DOCTOR

Doctor A: "This surgery has a 95% survival rate."
Doctor B: "This surgery kills 1 in 20 patients."

Would you feel the same way hearing both? Most people feel much more scared by the second version — even though 95% survival and 1 in 20 death rate are mathematically identical.

Loss framing (focusing on the bad outcome) feels scarier than gain framing (focusing on the good outcome), even with identical numbers.

ON A REPORT CARD

Kid to parents: "I got 7 out of 10 questions right!"
Parents saw: "Got 3 wrong out of 10."

Same test. Same score. The kid frames it as mostly right; the parents frame it as too many wrong.

We naturally choose the frame that supports our position. The kid emphasizes the 70% right; the parent emphasizes the 30% wrong.

Why It Fools People

Our brains are wired to react differently to gains vs. losses, even when they're the same thing. Framing exploits this emotional wiring. We don't process "90% fat-free" and "10% fat" as the same fact — we FEEL them differently.

How to See Through It

1. Flip the frame. If something is presented positively, restate it negatively (and vice versa).
2. Ask: "Would I feel differently if this same number was presented the other way?"
3. Focus on the actual number, not the spin around it.
4. Be suspicious when only one frame is given — someone chose that frame for a reason.

Try It!

Reframe these: "This sunscreen blocks 97% of UV rays" → How does it sound as a negative frame? "8 out of 10 kids prefer our cereal" → What does the other frame sound like? Practice flipping frames — it's a data detective superpower.
Chapter 9

Polls & Surveys Gone Wrong

"Garbage In, Garbage Out"

A survey form with leading questions and biased answer options

What's the Trick?

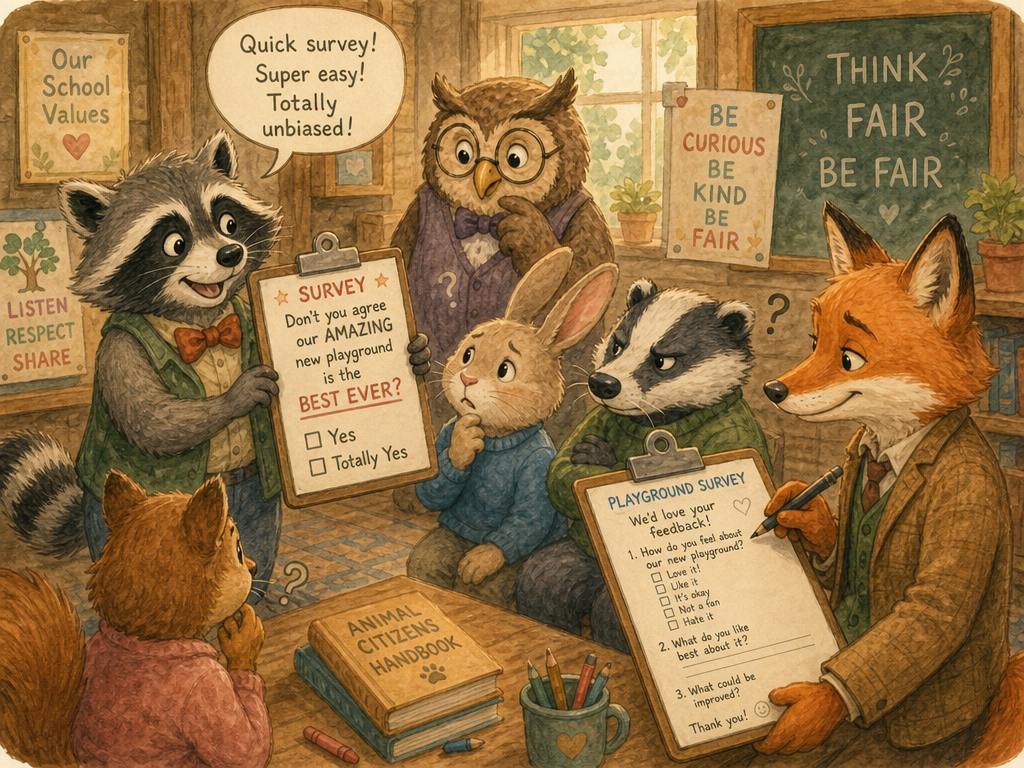
Surveys and polls can look scientific, but the way questions are written can control the answers. Leading questions, loaded words, limited choices, and biased samples can make any survey produce any result you want. If you put garbage questions in, you get garbage data out.

Tricks in the Wild

LEADING QUESTIONS

Bad survey: "Don't you agree that our amazing new school playground is the best improvement ever?"

Better version: "How would you rate the new playground? (1-5 stars)"

The first question practically tells you what to answer. It's loaded with positive words ("amazing," "best ever") and starts with "Don't you agree" which pressures you to say yes.

Leading questions are designed to push you toward a specific answer. A fair question is neutral and lets you answer honestly.

LIMITED CHOICES

Survey: "What's the most important subject? A) Math B) Science C) Math AND Science"

Where's English? History? Art? Music? Gym? By only offering math and science as options, the survey guarantees the result: "100% of students think STEM subjects are the most important!"

If the options don't include all reasonable answers, the results are rigged from the start.

LOADED SCALES

Survey: "Rate our service: Excellent / Great / Good / Acceptable"

Notice anything missing? There's no negative option! The worst you can say is "acceptable." This guarantees the company can claim "100% of customers rated us acceptable or better!"

When every answer option is positive, you can't express a negative opinion. The results will always look good.

ONLINE POLLS

Website: "POLL: Should homework be banned? YES / NO"
Result: "94% say YES!"

Online polls attract people who feel strongly about the topic. Kids who hate homework rushed to vote; kids who don't mind it just scrolled past.

Self-selected online polls are popularity contests, not real research. The people who bother to vote are NOT representative of the general population.

Why It Fools People

"A survey found that..." sounds like science. But the quality of a survey depends entirely on how the questions are written, who is asked, and what answer options are given. A badly designed survey can "prove" literally anything.

How to See Through It

1. Read the actual question that was asked — was it neutral or leading?
2. Check the answer options — are all reasonable viewpoints represented?
3. Ask who was surveyed — random sample or self-selected group?
4. Look for the word "online poll" — that's almost always meaningless data.

Try It!

Write two survey questions about school lunch. One should be a leading question designed to get the answer "school lunch is great." The other should be a fair, neutral question. Compare them. Notice how the wording changes everything?
Chapter 10

The Ice Cream Murder Mystery

"When Data Tells a Fake Story"

Ice cream cones and pirates connected by ridiculous arrows of fake causation

What's the Trick?

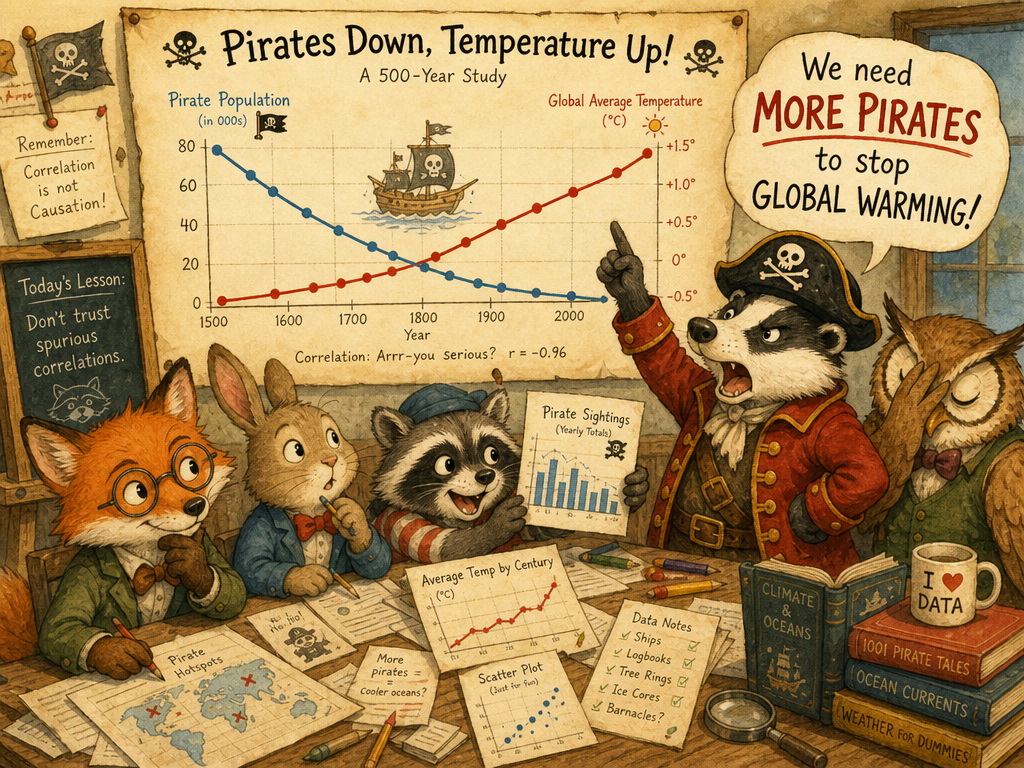
Just because two things happen at the same time doesn't mean one caused the other. This is called correlation without causation, and it's one of the most common data tricks in the world. Two data lines can move together for completely unrelated reasons — and the results can be absolutely hilarious.

Tricks in the Wild

THE CLASSIC: ICE CREAM AND DROWNING

Data: When ice cream sales go up, drowning deaths also go up. Correlation: nearly perfect.

Conclusion? Ice cream causes drowning? BAN ICE CREAM!

Reality: Both increase in summer because of HOT WEATHER. People eat more ice cream AND go swimming more when it's hot. Ice cream has nothing to do with drowning.

The hidden third variable (summer heat) causes BOTH. This is called a confounding variable — an invisible factor that drives both trends.

PIRATES AND GLOBAL WARMING

Data: As the number of pirates has decreased over the last 200 years, global temperatures have increased. Tight correlation!

Conclusion? Pirates prevent global warming? We need MORE pirates!

Reality: Obviously ridiculous. Two unrelated trends that happen to move in opposite directions over time.

With enough data, you can find correlations between almost ANYTHING. That doesn't make any of them meaningful.

ON SOCIAL MEDIA

Post: "Countries where people eat more cheese have more Nobel Prize winners! Cheese makes you smarter!"

Reality: Wealthier countries tend to both consume more cheese AND invest more in education and research. Wealth is the hidden variable — not cheese.

Wealth, education, and nutrition all go together in developed countries. Attributing Nobel Prizes to cheese is hilarious but wrong.

IN SCHOOL

Observation: "Kids who eat breakfast get better grades. Therefore, breakfast makes you smarter!"

Think deeper: Kids who eat breakfast might also have more stable home lives, more sleep, and more support with homework. Breakfast alone might not be the cause.

There could be many hidden variables. Families that ensure breakfast may also ensure homework time, bedtimes, and school attendance. Correlation isn't causation.

Why It Fools People

Our brains are pattern-matching machines. When we see two things moving together, we instinctively create a story connecting them. "A went up AND B went up, so A must cause B!" It feels logical. But the universe is full of coincidences, hidden variables, and trends that move together for no meaningful reason at all.

How to See Through It

1. The golden rule: correlation does NOT equal causation.
2. Ask: "Is there a hidden third variable causing BOTH?"
3. Ask: "Could this be a coincidence?"
4. Ask: "Does it even make logical sense that A would cause B?"
5. For fun, visit tylervigen.com — a whole website of absurd spurious correlations!

Try It!

Here's a real correlation: cities with more firefighters also have more fires. Does that mean firefighters CAUSE fires? Obviously not! Bigger cities have both more fires AND more firefighters. The hidden variable is city size. Now you try: "Students who take more practice tests get better SAT scores." Is that causation? Or could a hidden variable explain it?

Becoming a Data Detective

Your 5 questions to crack any number's case

The Data Detective Toolkit

1
"Compared to what?" A number by itself means nothing. 10,000 sounds like a lot... unless the total is 10 million. Always ask for context and comparison.
2
"Who collected this, and why?" A toothpaste company studying toothpaste might have some motivation to find positive results. Consider the source and their possible biases.
3
"What's missing?" What data was left out? What time range wasn't shown? Who wasn't surveyed? The data you DON'T see can be more important than the data you do.
4
"Is the sample big enough and fair enough?" Five friends isn't a study. An online fan poll isn't a survey. Good data requires large, random, diverse samples.
5
"Would the number feel different framed another way?" Flip the frame. Convert the percentage to real numbers. Swap the mean for the median. If the story changes, someone chose the version that benefits them.

Why This Matters

Learning to question numbers isn't about becoming suspicious of everything. It's about becoming smarter about the information you consume.

When you can spot data tricks, you:

Numbers are everywhere — in your grades, your game stats, the news, your doctor's advice, and every ad you see. Learning to read them critically is one of the most powerful skills you can develop.

Be Skeptical, Not Cynical

There's an important difference. A skeptic asks good questions and looks for real evidence. A cynic assumes everything is a lie and trusts nothing. Don't become a cynic.

Most people sharing data aren't trying to trick you. But some are. And even well-meaning people can accidentally mislead with numbers. Your job isn't to assume the worst — it's to ask the right questions so you can tell the difference.

Data, when used honestly, is one of the most powerful tools in the world. It cures diseases, solves problems, and helps us understand reality. The tricks in this book are the exceptions — but they're common enough that you need to know how to spot them.

Now Go Investigate!

You've graduated from Data Detective Academy. You know the 10 tricks. You have the 5 questions. You're ready.

"The greatest enemy of knowledge is not ignorance, it is the illusion of knowledge."
— Daniel J. Boorstin

The next time someone throws a number at you, don't just accept it. Ask questions. Check the source. Flip the frame. Look for what's missing. You've got this.

Glossary

Misleading Graph — A graph that uses visual tricks (cropped axes, 3D effects, weird scales) to make data look different than it really is.
Cherry-Picking — Selecting only the data points that support your argument while ignoring the rest.
Mean (Average) — Add all numbers up and divide by how many there are. Easily skewed by extreme values.
Median — The middle value when all numbers are lined up in order. More resistant to outliers than the mean.
Base Rate — How common or rare something is in the general population before any test or measurement.
Survivorship Bias — Drawing conclusions only from the "survivors" (winners, successes) while ignoring all the failures that are invisible.
Sample Size — The number of people or data points in a study. Larger samples generally give more reliable results.
Selection Bias — When the people in a sample aren't representative of the larger population, skewing the results.
Framing Effect — The way a number is presented (positive vs. negative frame) changes how people feel about it, even though the fact is the same.
Correlation — When two things happen together or move in the same pattern.
Causation — When one thing actually causes another to happen. Much harder to prove than correlation.
Confounding Variable — A hidden third factor that causes both things you're observing, creating a false appearance of a direct connection.
False Positive — When a test says something is true when it's actually false (like a fire alarm going off when there's no fire).
Leading Question — A survey question written to push the respondent toward a specific answer.